
Once or twice a year I am taking part in the #plotparty event organized by @penplotart in instagram. Although it is always one o f the most intense weeks of the year, I quite enjoy the fact that it forces me to get more experimental and let lose (as lose as a control freak like me can possibly get 😉
Two of my favourites by far are the “Rain Plots” and the “Wind Maps”.
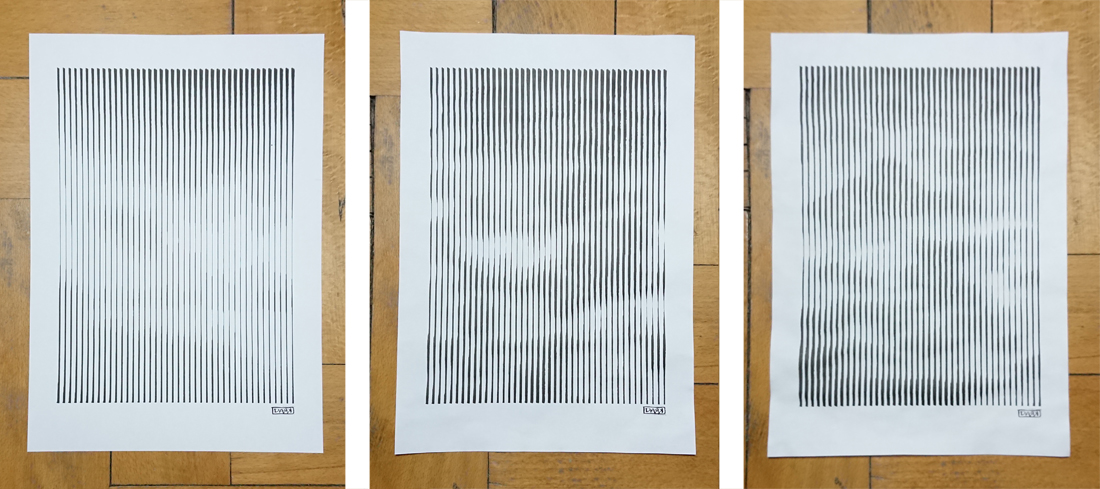
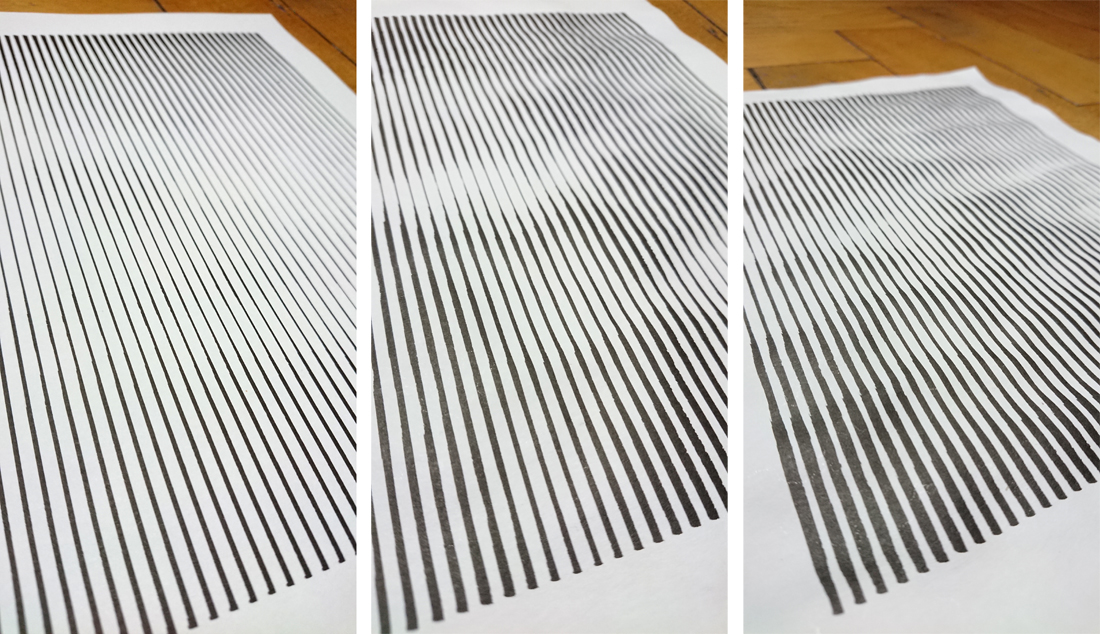
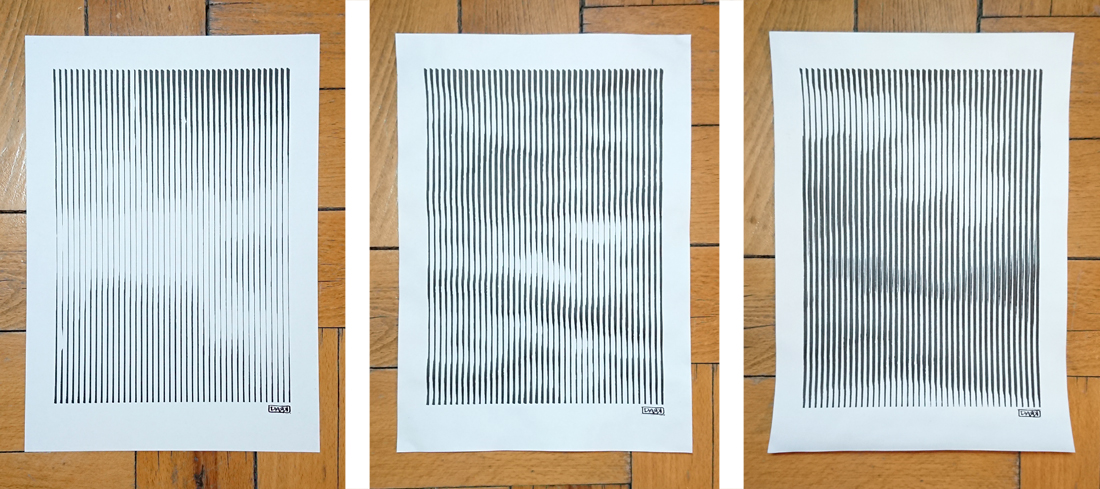
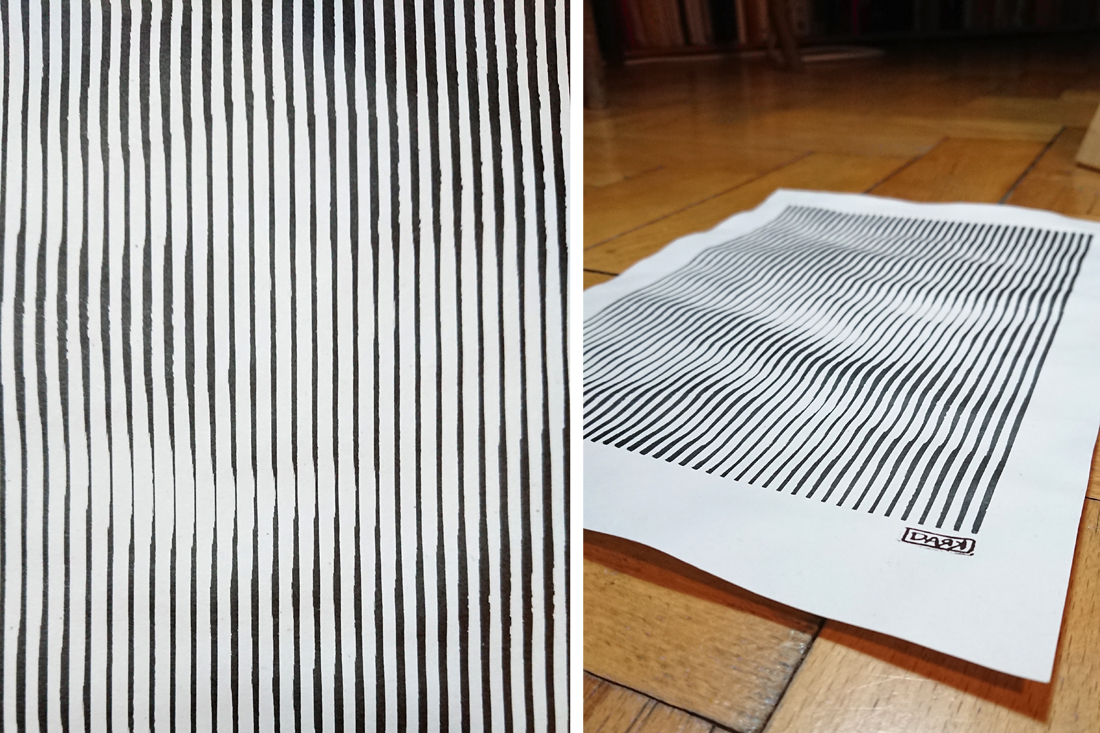
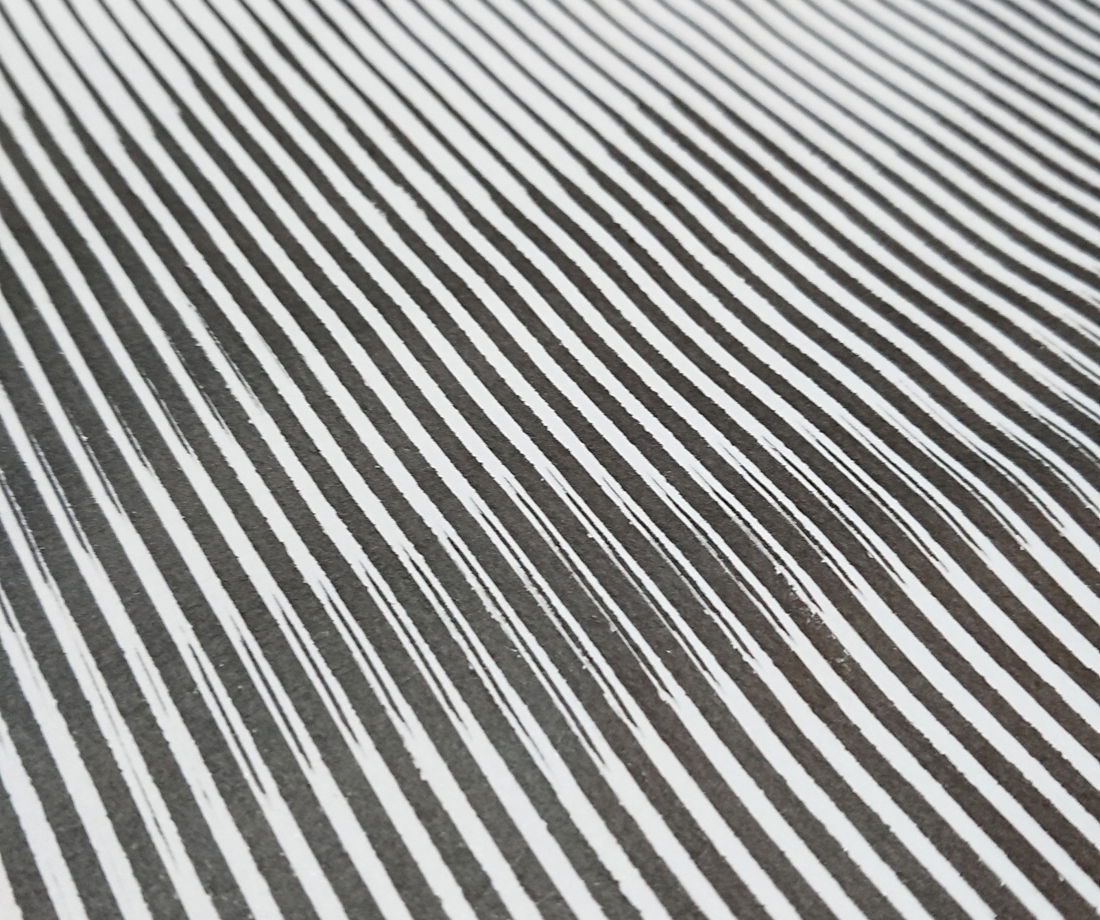
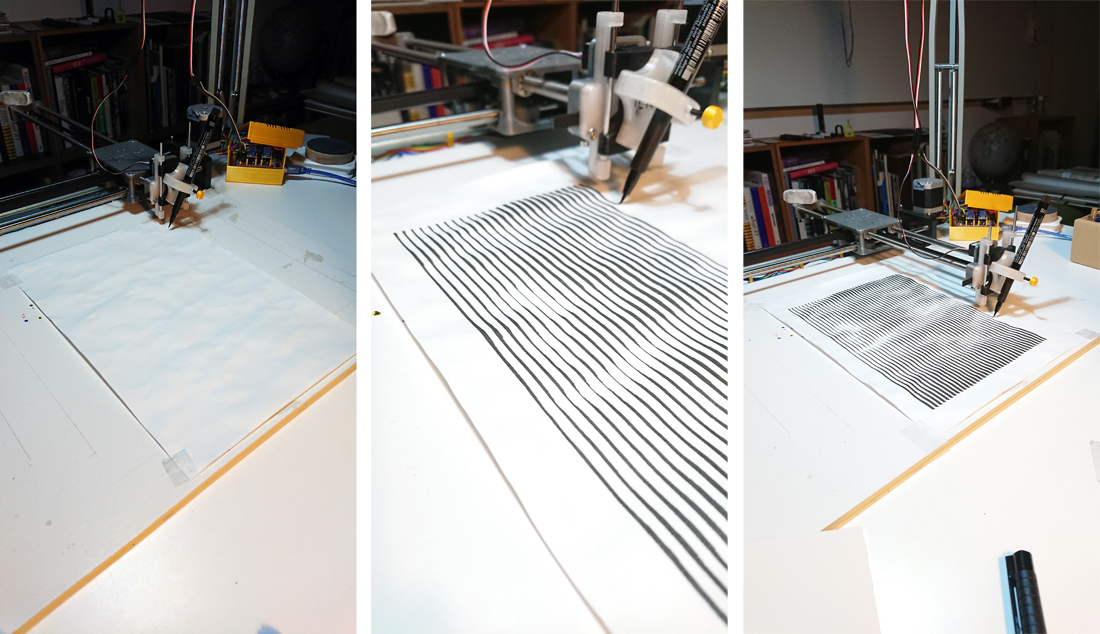
For the “Rain Plots” I dropped different types of paper sheets for 2 and 5 minutes into Viennese drizzling summer rain and then simply drew 42 (Douglas Adam’s says hi) straight black ink lines with a soft brush pen on the re-dried and undulating sheets.
15 min plotting time each. 21 x 29.7 cm.
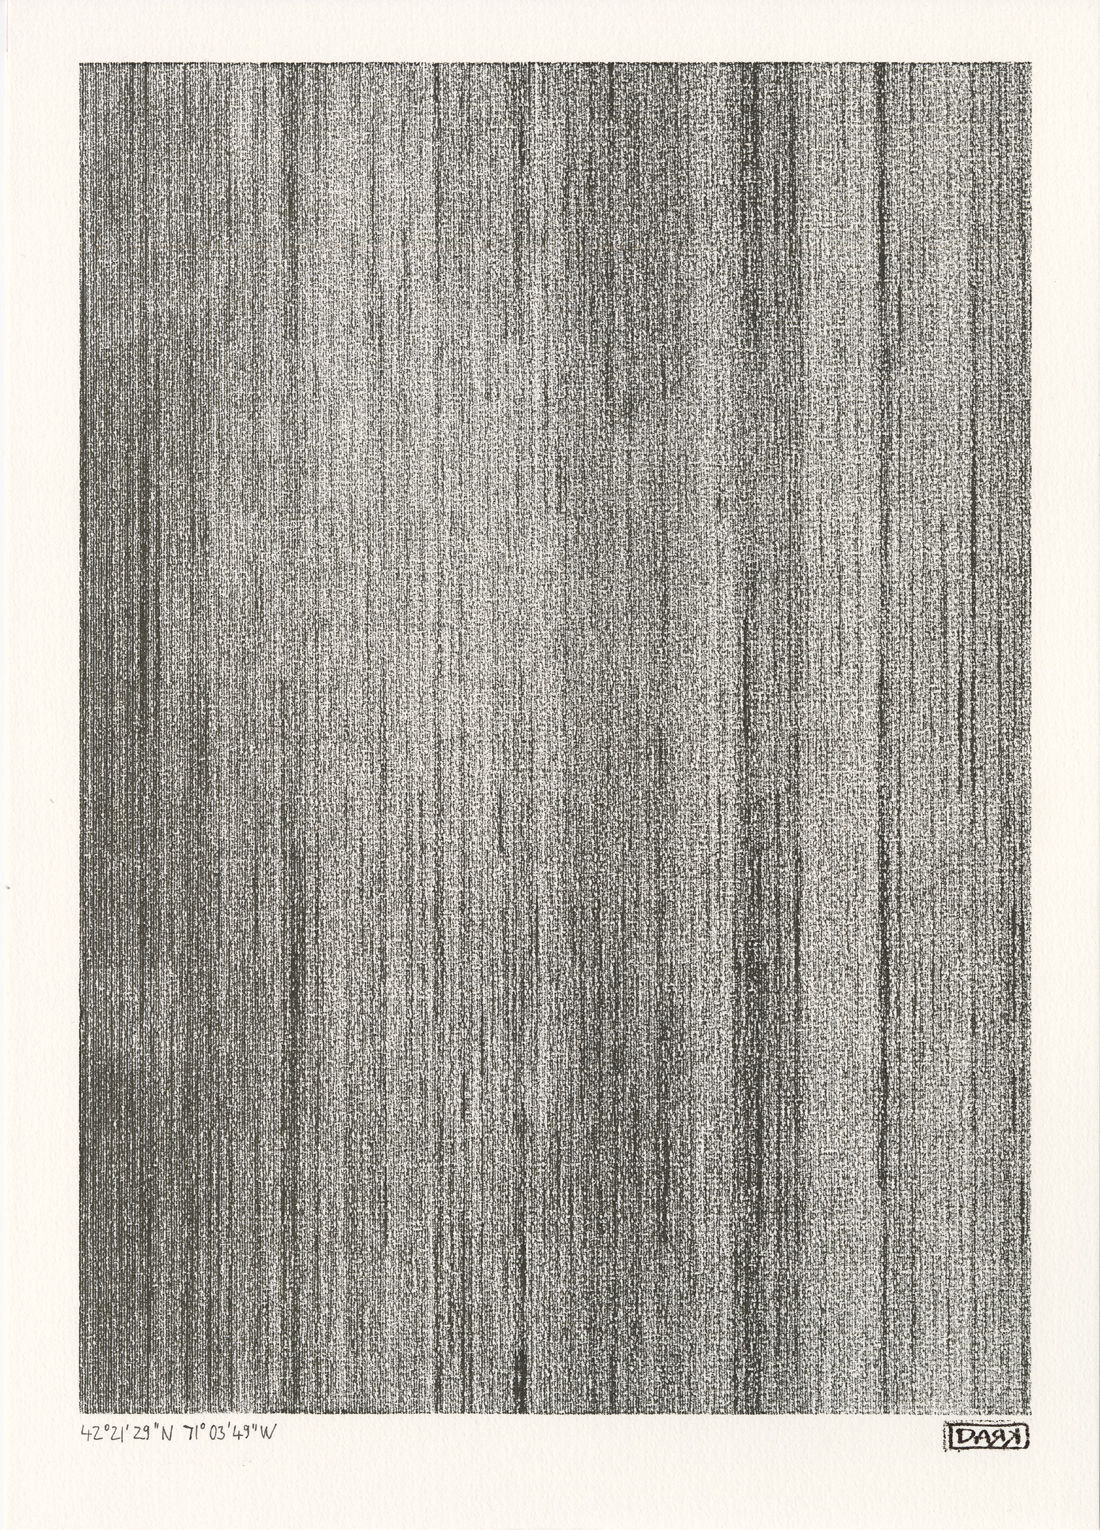
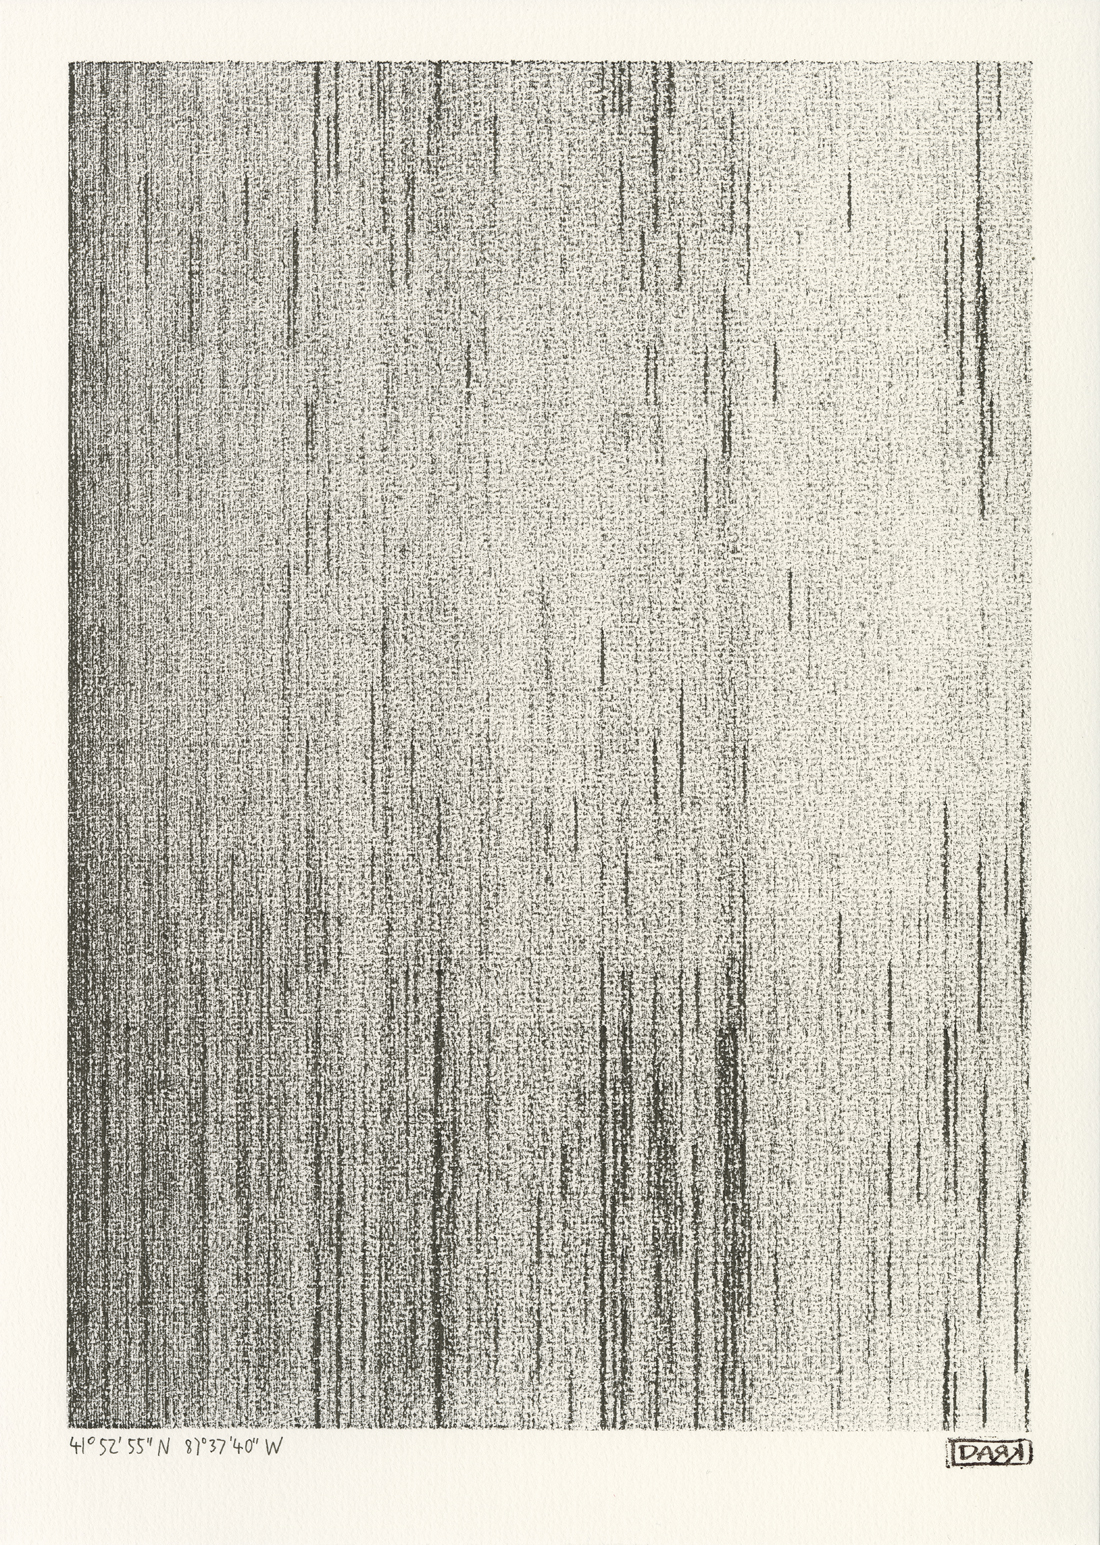
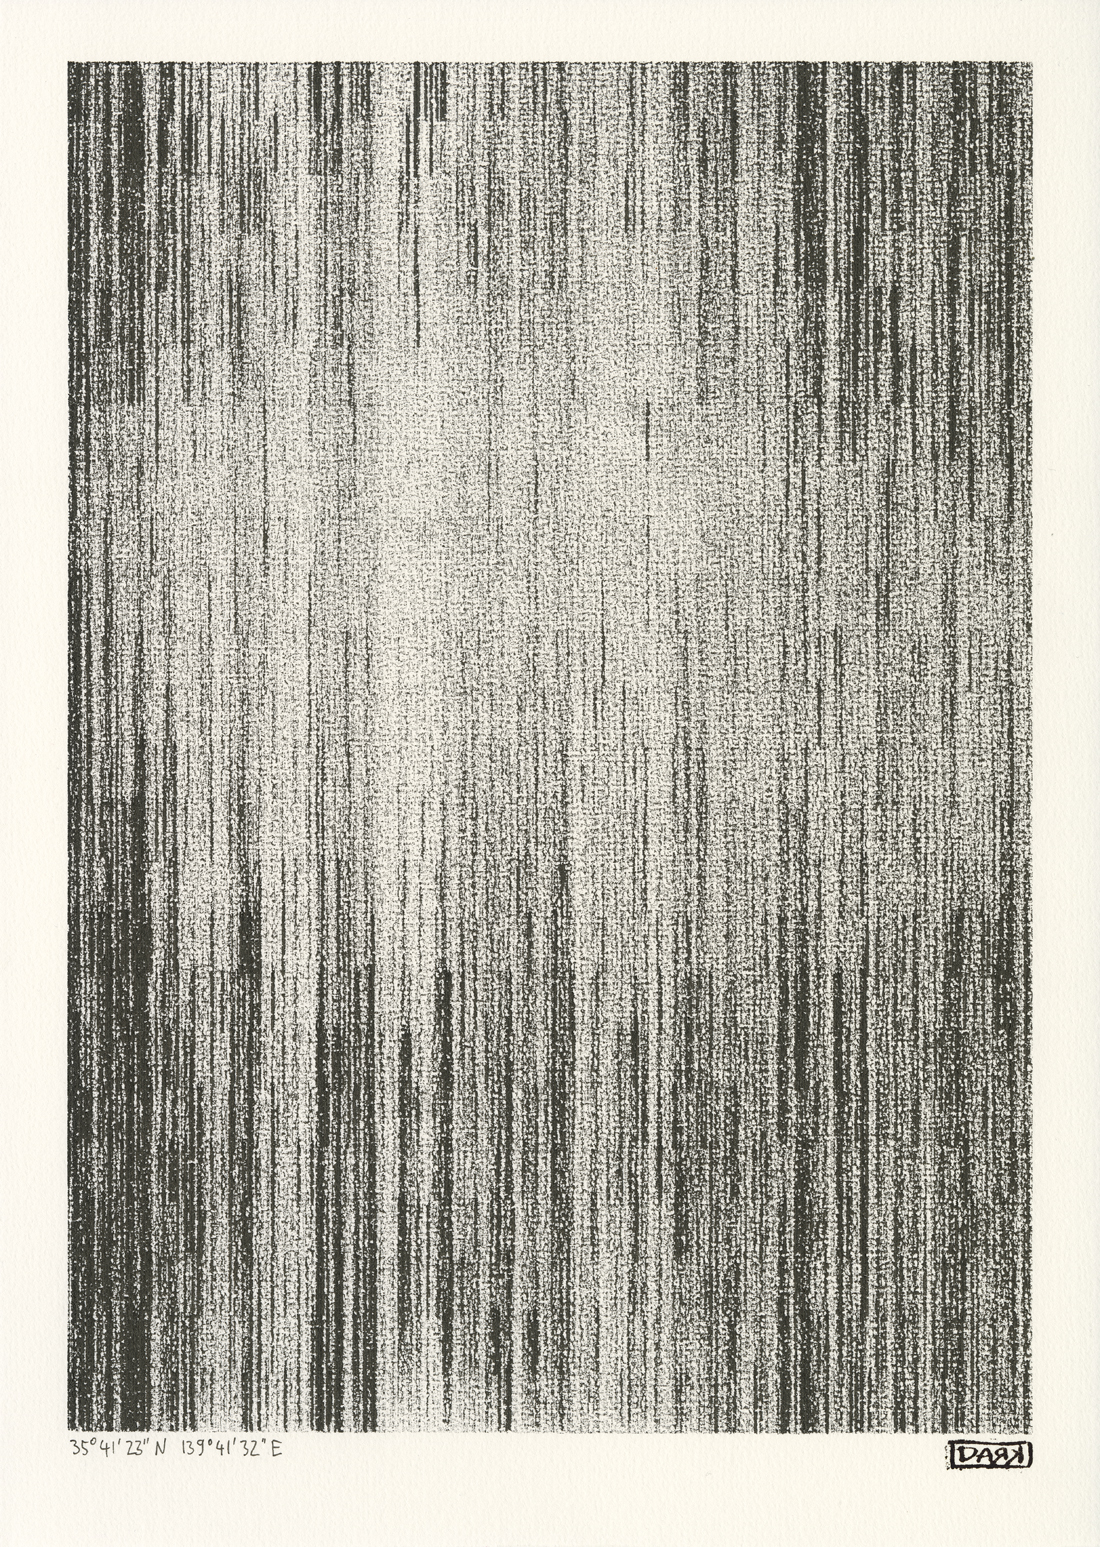
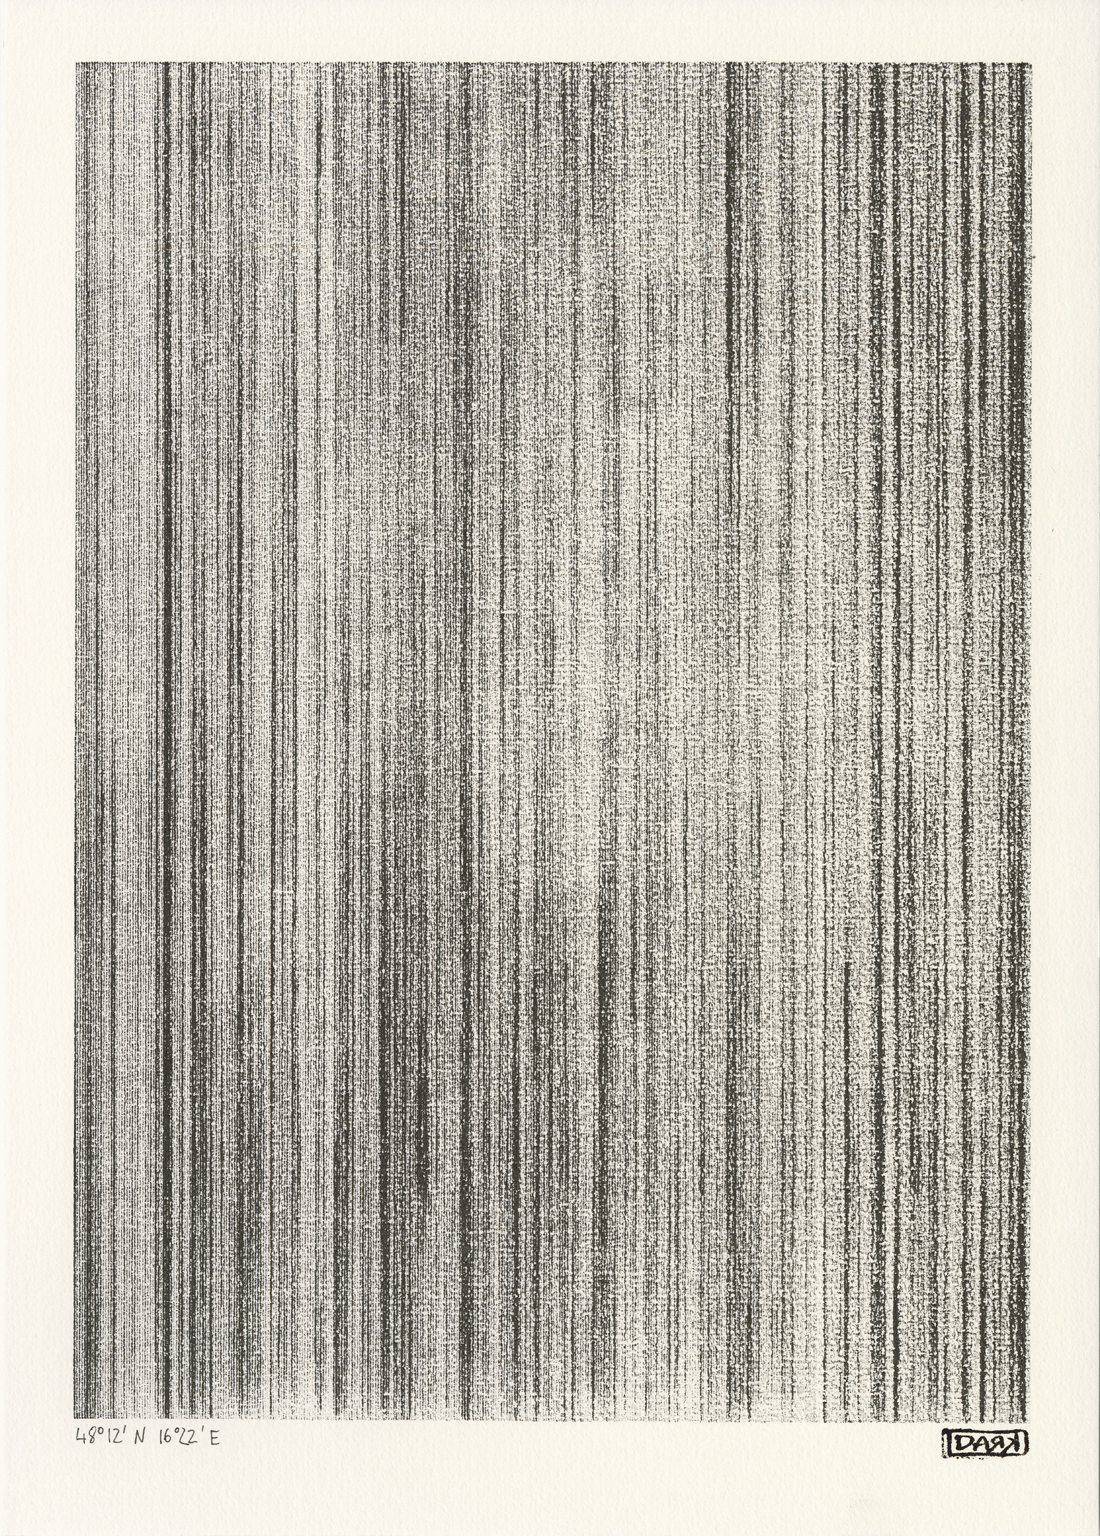
For the “Wind Maps” I finally got to play around with custom gcode generation: translating wind velocity data from epw weather files (Boston, Vienna, Tokyo, Los Angeles, Chicago) into the penplotter’s feedrate.
365 (days of the year) straight lines, made up of 24 (hours per Day) segments each. The individual segments are drawn between 100mm/min (no wind) and 10000mm/min (theoretically, i don’t think my Plotter can go that fast especially on a segment that’s only about 12mm long…..
Black ink on clairefontaine grained paper 180g. 21 x 29.7 cm. Between 1 h 15 min to 4 h 50 min plotting time each.